Vendor Performance Drift Detector

Creating a vendor feedback platform to enable vendors and suppliers to exchange feedback and gain insights into working relationships for Abbott.

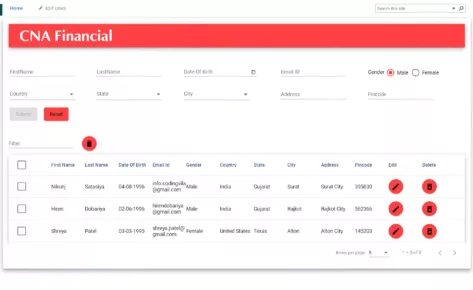
Empowering the US Chamber of Commerce with a versatile white label portal, an intuitive financial dashboard, and a custom API for seamless data integration.
Developing a lightning-fast, fuzzy search solution for a Sharepoint-integrated Angular JS app.
Empowering an Industry Leader with Email Migration and Security Enhancement
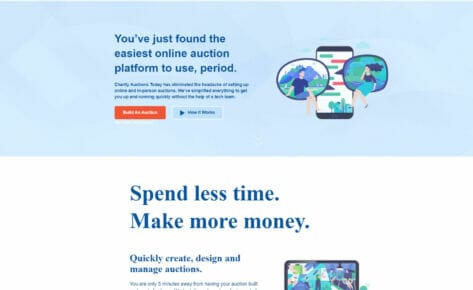
Enhancing customer support for an online charity auction platform with integrated CRM, sentiment analysis, and streamlined communication channels.

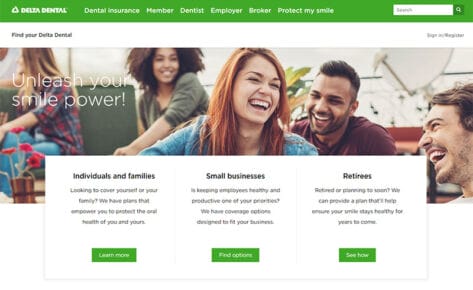
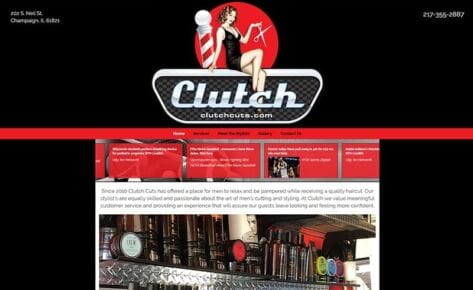
Creating a bespoke, personalized website for a leading weight loss clinic, emphasizing individualized care and secure communication of sensitive medical information.
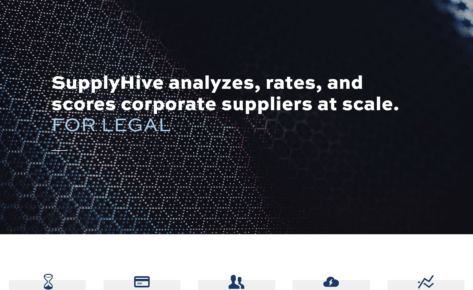
Building a first of it’s kind procurement feedback platform for Diversity Suppliers / Buyers.

Overhaul of search and tagging structure using NLP, translated into 4 languages

Developing a custom dashboard with seamless AI integrations and API connections to empower SMB owners with enhanced performance visibility and streamlined data management.

Empowering Hoodle with strategic marketing support to implement ClickFunnels effectively and offering design mockups to breathe new life into their website

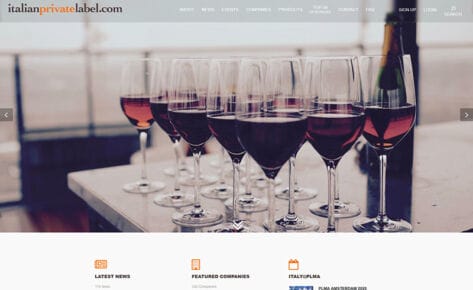
Early development of the website increased daily traffic to 180,000 users.

The Italian Trade Agency works alongside Italian companies to ensure them the greatest success on international markets and to encourage foreign companies to look to Italy as a reliable global partner.

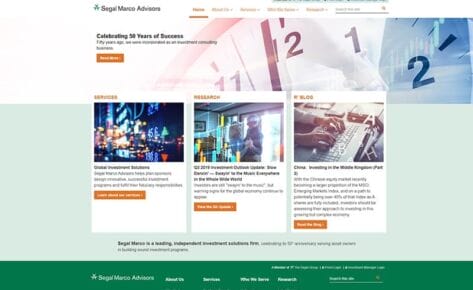
Empowering a law firm through a website overhaul, Google Analytics strategy and implementation, and targeted PPC campaigns.
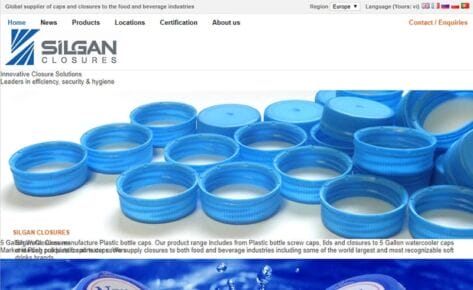
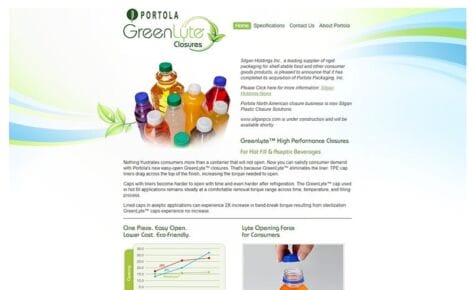
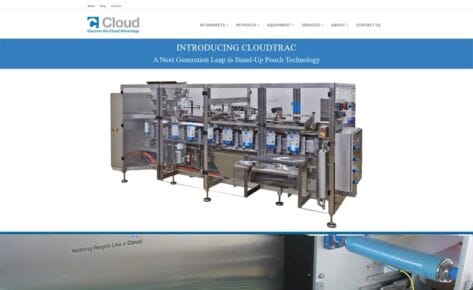
Silgan Closures manufacture Plastic bottle caps.